
Page 130 - AERB Annual Report 2020
P. 130
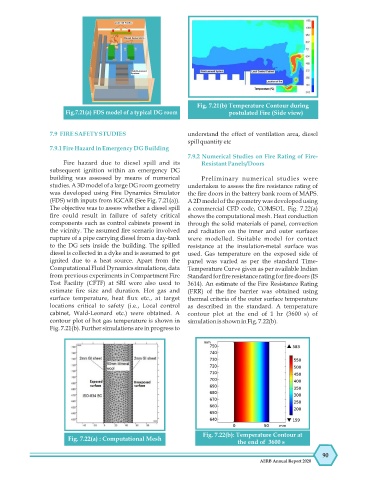
Fig. 7.21(b) Temperature Contour during
Fig.7.21(a) FDS model of a typical DG room postulated Fire (Side view)
7.9 FIRE SAFETY STUDIES understand the effect of ventilation area, diesel
spill quantity etc
7.9.1 Fire Hazard in Emergency DG Building
7.9.2 Numerical Studies on Fire Rating of Fire-
Fire hazard due to diesel spill and its Resistant Panels/Doors
subsequent ignition within an emergency DG
building was assessed by means of numerical Preliminary numerical studies were
studies. A 3D model of a large DG room geometry undertaken to assess the re resistance rating of
was developed using Fire Dynamics Simulator the re doors in the battery bank room of MAPS.
(FDS) with inputs from IGCAR (See Fig. 7.21(a)). A 2D model of the geometry was developed using
The objective was to assess whether a diesel spill a commercial CFD code, COMSOL. Fig. 7.22(a)
re could result in failure of safety critical shows the computational mesh. Heat conduction
components such as control cabinets present in through the solid materials of panel, convection
the vicinity. The assumed re scenario involved and radiation on the inner and outer surfaces
rupture of a pipe carrying diesel from a day-tank were modelled. Suitable model for contact
to the DG sets inside the building. The spilled resistance at the insulation-metal surface was
diesel is collected in a dyke and is assumed to get used. Gas temperature on the exposed side of
ignited due to a heat source. Apart from the panel was varied as per the standard Time-
Computational Fluid Dynamics simulations, data Temperature Curve given as per available Indian
from previous experiments in Compartment Fire Standard for re resistance rating for re doors (IS
Test Facility (CFTF) at SRI were also used to 3614). An estimate of the Fire Resistance Rating
estimate re size and duration. Hot gas and (FRR) of the re barrier was obtained using
surface temperature, heat ux etc., at target thermal criteria of the outer surface temperature
locations critical to safety (i.e., Local control as described in the standard. A temperature
cabinet, Wald-Leonard etc.) were obtained. A contour plot at the end of 1 hr (3600 s) of
contour plot of hot gas temperature is shown in simulation is shown in Fig. 7.22(b).
Fig. 7.21(b). Further simulations are in progress to
Fig. 7.22(b): Temperature Contour at
Fig. 7.22(a) : Computational Mesh
the end of 3600 s
90
AERB Annual Report 2020